Maximum Drawdown in Trading: How to Calculate It and Keep It Small
Maximum drawdown is the largest peak-to-trough fall in your equity. How to calculate it, the recovery maths, and practical ways to limit drawdowns.
Every strategy has losing periods. Maximum drawdown measures the worst one: how far your account fell from its highest point before it recovered. It's the number that decides whether you survive long enough for your edge to play out.
What is maximum drawdown?
Drawdown is the drop from an equity peak to a subsequent low. Maximum drawdown (MDD) is the largest of those drops over the period you're measuring.
Example
Your account goes: $10,000 → $11,500 (peak) → $9,800 (trough) → $12,200.
Note that the drawdown is measured from the peak, not from your starting balance. Your account never fell below $10,000 by much, but you gave back $1,700 from the high.
The recovery problem
Losses and gains are not symmetric. After a drawdown, you need a bigger percentage gain to get back to the peak:
| Drawdown | Gain needed to recover |
|---|---|
| 5% | 5.3% |
| 10% | 11.1% |
| 20% | 25.0% |
| 30% | 42.9% |
| 40% | 66.7% |
| 50% | 100.0% |
This is why professional traders obsess over drawdown. Beyond about 20%, recovery takes far longer than the loss did, and the psychological pressure to "make it back" leads to the worst trades.
What causes large drawdowns?
When you dig into a drawdown in your journal, it almost always comes from one of these:
- Risk per trade that's too high. At 3% risk, eight losses in a row cost about 22%. At 1%, the same streak costs about 8%.
- Losing streaks you didn't plan for. With a 40% win rate, a run of 8+ losses is not rare over a few hundred trades.
- Tilt. Larger positions, more trades and broken rules after a loss turn a normal drawdown into a deep one. See revenge trading.
- Correlated positions. Long EURUSD, GBPUSD and AUDUSD at the same time is one bet on the dollar, at three times the risk.
- Regime change. A strategy built for trending markets bleeds in a range.
How to limit drawdown
Fix risk per trade
Risk a fixed percentage of your account, typically 0.5% to 1%, sized from your stop loss. See forex position sizing.
Use a daily loss limit
Stop trading for the day once you've lost, for example, 2% or 3%. This caps how much a single bad day can contribute. The PipLog EA can enforce it by blocking new panel orders once the limit is hit.
Cap trades per day
Most drawdown days are also overtrading days. A hard maximum of trades per day stops the spiral early.
Reduce size during drawdown
Some traders halve their risk after a 5% drawdown and restore it at a new equity high. It slows recovery a little but protects against the deep tail.
Plan for your losing streak
Look up your longest losing streak in your journal and multiply it by your risk per trade. If the result scares you, your risk is too high.
Reading drawdown in your journal
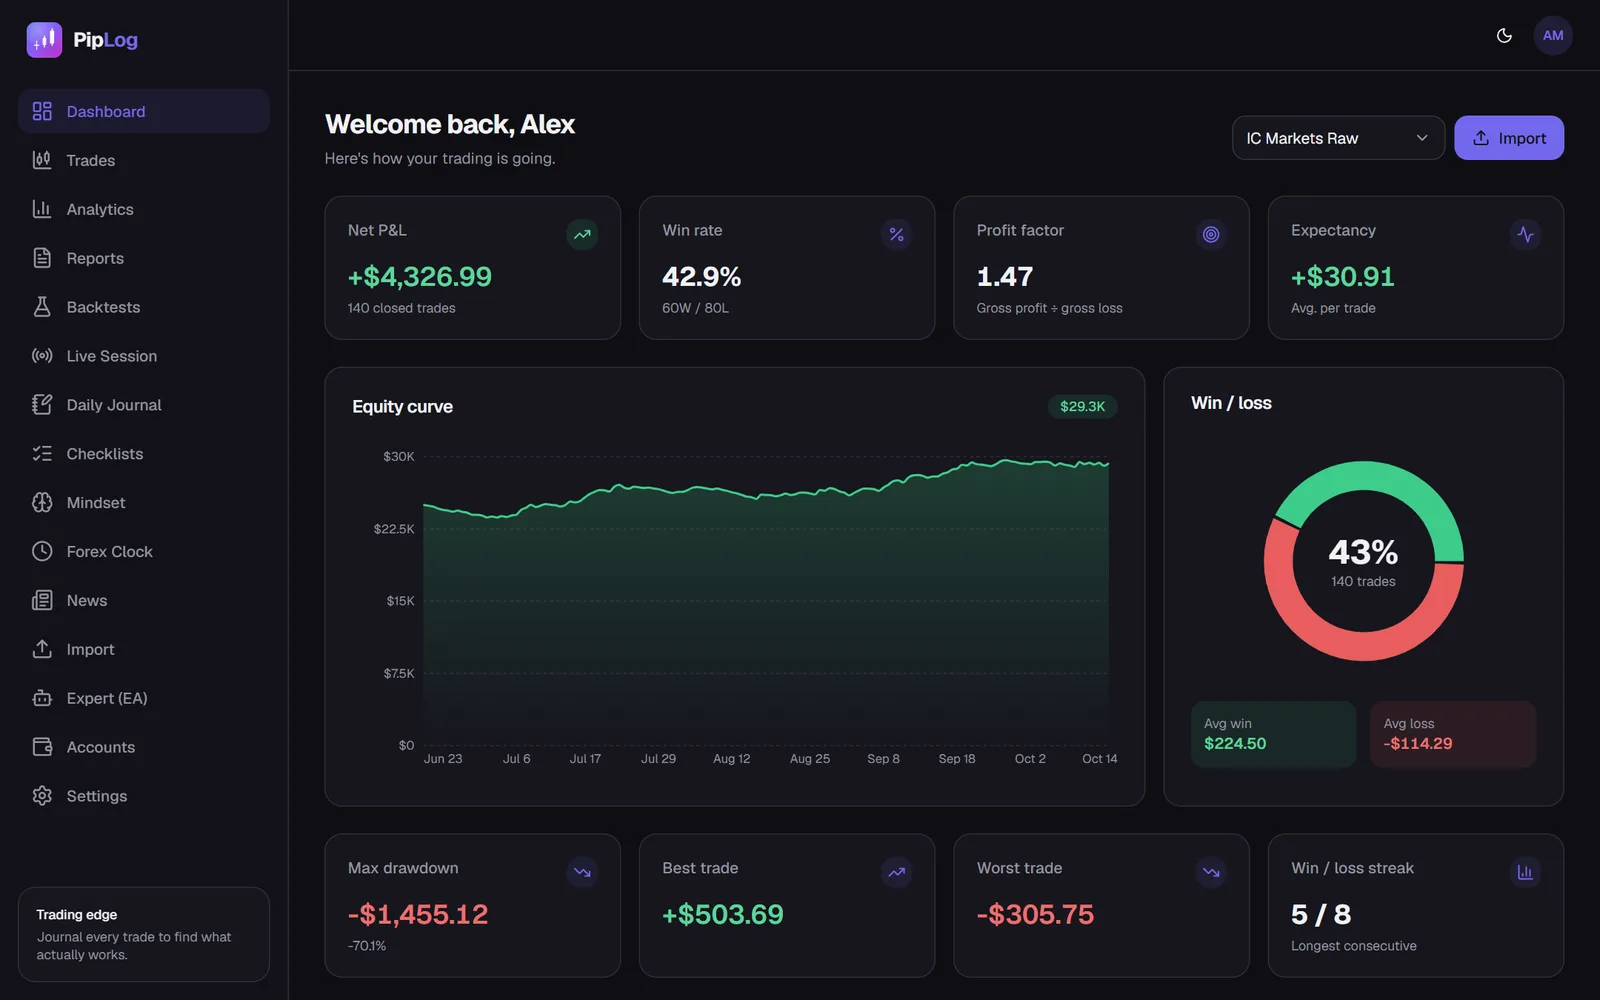
Your equity curve shows drawdowns visually: every dip below a previous high is one. PipLog shows maximum drawdown in money and percent on the dashboard, alongside your longest losing streak, and you can filter by account, which matters if you trade a prop firm challenge with strict drawdown rules.
Journal your MT4 & MT5 trades automatically
Import a statement or sync live with the PipLog EA. Win rate, profit factor, expectancy and drawdown are calculated for you.
Start your journalKey takeaways
- Maximum drawdown is measured from the equity peak, not from the starting balance.
- A 20% drawdown needs a 25% gain to recover; a 50% drawdown needs 100%.
- Risk per trade, daily loss limits and trade caps are the most effective controls.
- Review every drawdown in your journal: was it the strategy, or your behaviour?