Trading Expectancy: The Formula That Tells You If You Have an Edge
Expectancy combines win rate and risk-reward into one number: what you make per trade on average. Formula, examples, and the break-even win rate table.
If you could only track one number about your trading, it should be expectancy. It tells you how much you can expect to make, on average, every time you take a trade that fits your strategy. Positive expectancy over a large sample means you have an edge. Negative means you don't, no matter how good the last week felt.
The expectancy formula
Where the loss rate is 1 − win rate, and the average loss is a positive number.
Example
Over 100 trades:
- Win rate: 42%
- Average win: $260
- Average loss: $140
Every trade you take, on average, is worth $28. Take 20 trades a month and you can expect around $560, with plenty of variance along the way.
Expectancy in R
Dollar expectancy depends on your position size. To compare strategies or periods with different sizes, express it in R, where 1R is the amount you risked on the trade:
With a 42% win rate, winners averaging 1.9R and losers averaging 1.0R:
At 1% risk per trade, that's about 0.22% of your account per trade on average. More on this in R-multiples.
Win rate vs. risk-reward
The most common question in trading forums is "what win rate do I need?". The answer depends entirely on your average reward-to-risk. The break-even win rate is:
| Average R:R | Break-even win rate |
|---|---|
| 0.5 : 1 | 66.7% |
| 1 : 1 | 50.0% |
| 1.5 : 1 | 40.0% |
| 2 : 1 | 33.3% |
| 3 : 1 | 25.0% |
| 4 : 1 | 20.0% |
Any win rate above the break-even line produces positive expectancy, before costs. That's why a 40% win rate can be excellent and a 70% win rate can be a losing strategy.
How many trades do you need?
Expectancy from 20 trades is mostly luck. As a rough guide:
- Under 30 trades: don't draw conclusions
- 50 – 100 trades: a first indication
- 100+ trades: reasonably reliable for a single setup
- Several hundred: needed to compare setups with small differences
That's why it pays to track expectancy per setup. You'll reach a useful sample for your main setup long before you can judge the rare ones.
Expectancy, profit factor and drawdown
Expectancy and profit factor are closely related: both are positive (or above 1) when you have an edge. Expectancy tells you how much you make per trade. Profit factor tells you how efficiently your wins cover your losses. Neither tells you how rough the ride is, so check maximum drawdown and your longest losing streak too.
Five ways to improve expectancy
- Drop negative-expectancy setups. Group your trades by setup; remove the ones below zero after 50+ trades.
- Avoid your worst hours and days. Breakdowns by weekday and session often show a clear leak.
- Hold winners to target. Raising average win from 1.1R to 1.8R at a 45% win rate takes expectancy from −0.06R to +0.26R.
- Respect your stop. Losses larger than 1R are the most direct expectancy killer.
- Remove impulse trades. Revenge trades and FOMO entries almost always have negative expectancy.
Tracking expectancy automatically
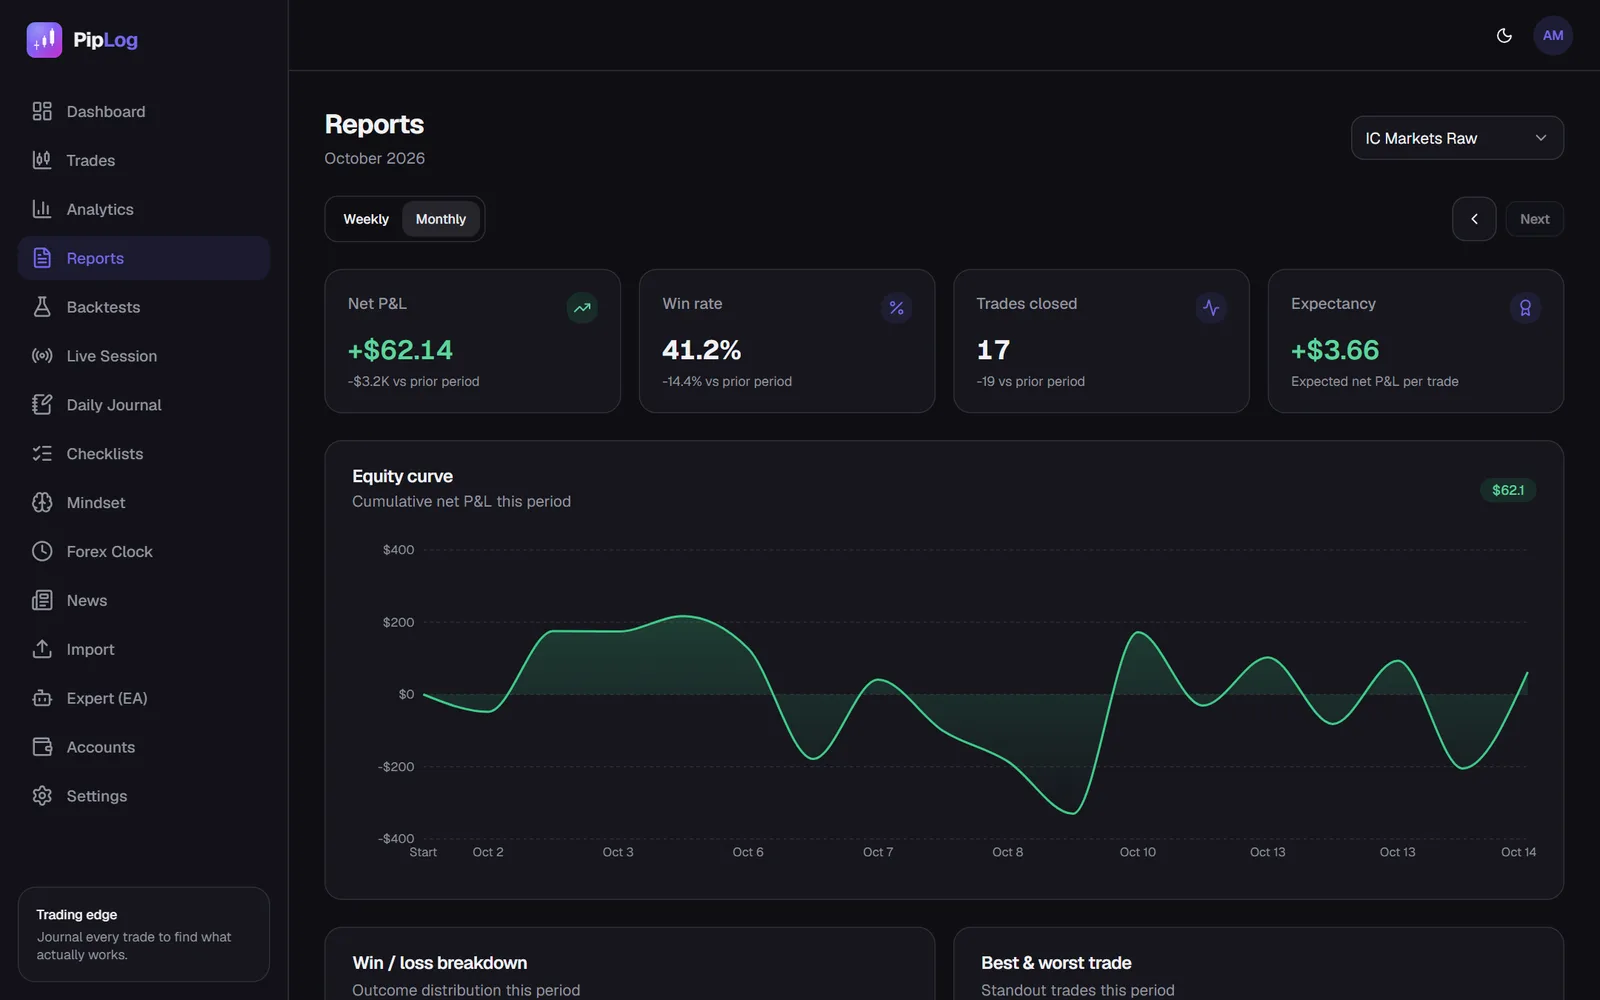
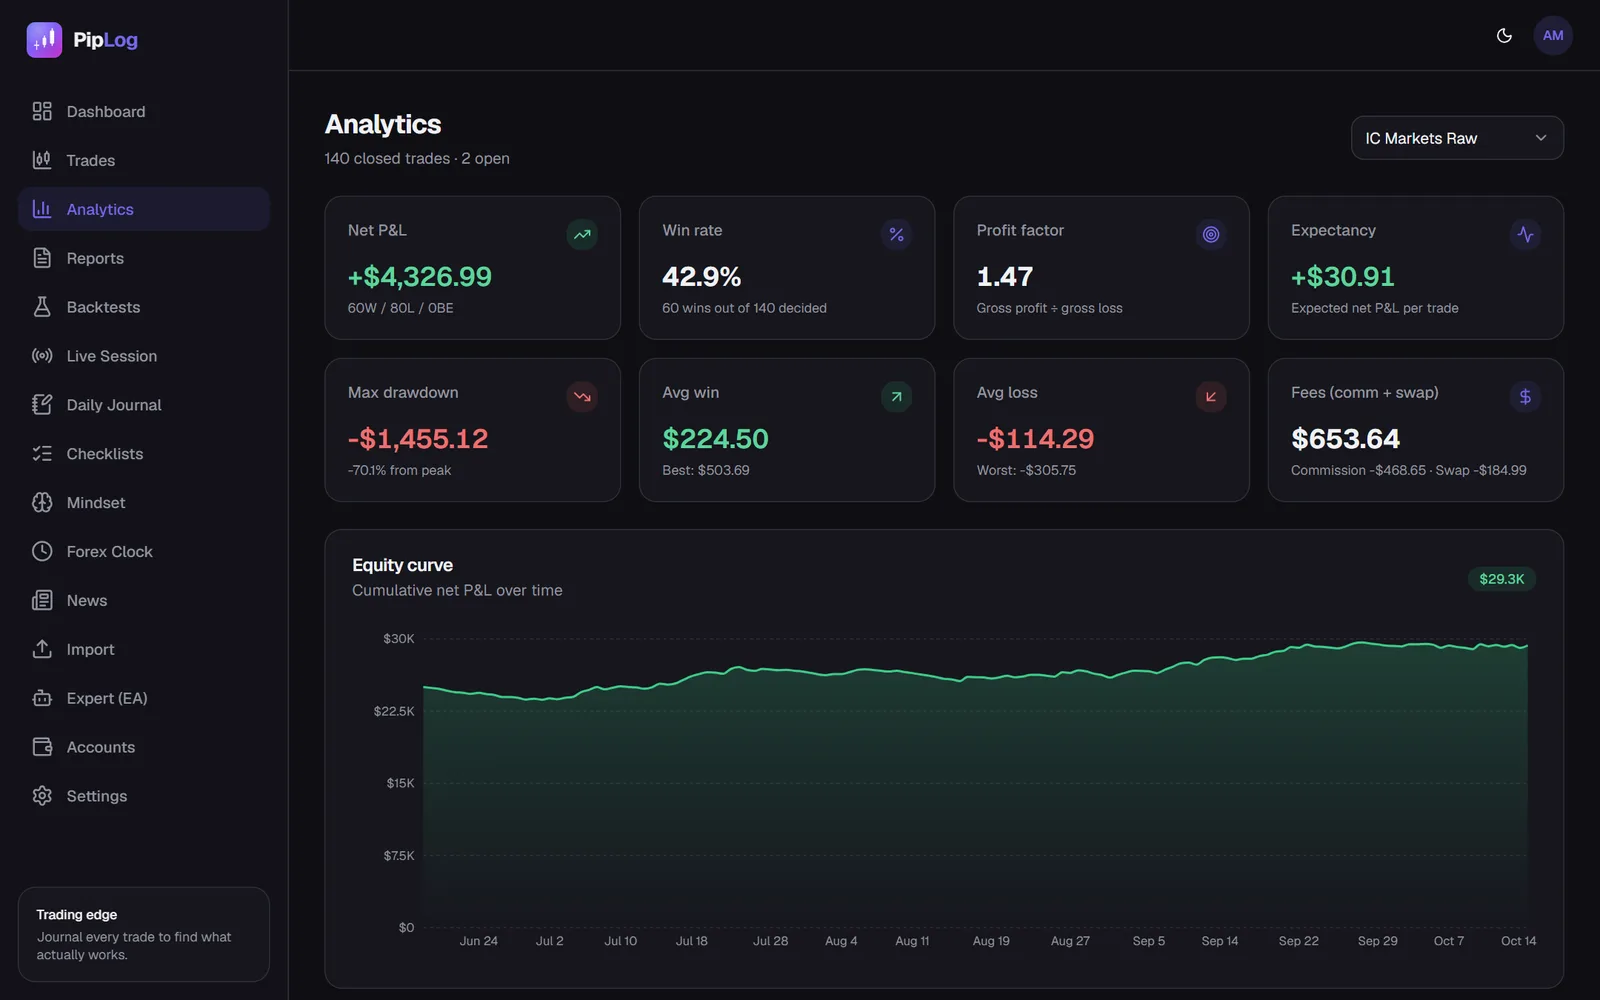
PipLog calculates expectancy for every filter you apply: per account, symbol, weekday, direction, month or tag, both in money and through average realised R. Import your MT4 or MT5 history and the numbers are there immediately.
Journal your MT4 & MT5 trades automatically
Import a statement or sync live with the PipLog EA. Win rate, profit factor, expectancy and drawdown are calculated for you.
Start your journal