Profit Factor Explained: Formula, Examples and What Counts as Good
Profit factor is gross profit divided by gross loss. Learn how to calculate it, what a good profit factor is for forex traders, and its blind spots.
Profit factor is one of the first numbers in every MetaTrader report and every trading journal, and one of the most useful. It answers a simple question: for every dollar you lose, how many do you make?
The profit factor formula
- Gross profit is the sum of all winning trades.
- Gross loss is the sum of all losing trades, taken as a positive number.
Use net results per trade (after commission and swap) for both. Otherwise costs quietly inflate the number.
A worked example
Over a month you close 40 trades:
| Trades | Total | |
|---|---|---|
| Winners | 18 | +$5,400 |
| Losers | 22 | −$3,600 |
You make $1.50 for every $1.00 you lose. Notice that the win rate here is only 45%. Profit factor already accounts for the size of wins and losses, which is why it's more informative than win rate on its own.
What is a good profit factor?
| Profit factor | Interpretation |
|---|---|
| Below 1.0 | Losing money |
| 1.0 – 1.2 | Roughly break-even; costs or a bad month can push it negative |
| 1.2 – 1.5 | Profitable, modest edge |
| 1.5 – 2.0 | Strong for discretionary trading |
| 2.0 – 3.0 | Excellent, verify the sample size |
| Above 3.0 | Rare over large samples; often a small sample or curve fitting |
These ranges are rules of thumb. A high-frequency scalper with a profit factor of 1.2 over 3,000 trades can be far more robust than a swing trader with 3.0 over 25 trades.
Profit factor and win rate together
Profit factor can be rewritten in terms of win rate and payoff ratio:
So two very different traders can share the same profit factor:
- Trader A: 65% win rate, average win $100, average loss $123 → PF ≈ 1.5
- Trader B: 35% win rate, average win $300, average loss $90 → PF ≈ 1.8
Trader B will have much longer losing streaks, even with the better profit factor. Your strategy and your psychology need to match the shape of your results, not only the headline number.
Blind spots of profit factor
It ignores sample size
A profit factor from 15 trades is noise. Wait for at least 50, ideally 100+, before drawing conclusions.
It ignores the order of trades
Profit factor says nothing about how deep your drawdowns were. Two traders with PF 1.5 can have a 6% or a 35% maximum drawdown. Always read it alongside maximum drawdown.
It can't see risk per trade
If you doubled your size on a few lucky winners, profit factor improves while your process got worse. Measuring results in R-multiples fixes this.
Undefined with no losses
With zero losing trades, profit factor is infinite. That's a sign the sample is too small, not that you've found the holy grail.
How to improve your profit factor
- Cut your worst setup. Break profit factor down by setup and symbol. Removing one losing setup often lifts the total more than optimising the good ones.
- Stop moving stop losses away from price. Average loss is half the formula.
- Let winners reach target. Compare planned R:R with realised R. If you plan 2R but average 1.1R on winners, early exits are costing you.
- Reduce costs. On short-term strategies commission and spread can take 0.1 to 0.3 off your profit factor.
- Remove revenge trades. Trades opened right after a loss tend to have the worst profit factor of all. See revenge trading.
Profit factor in your journal
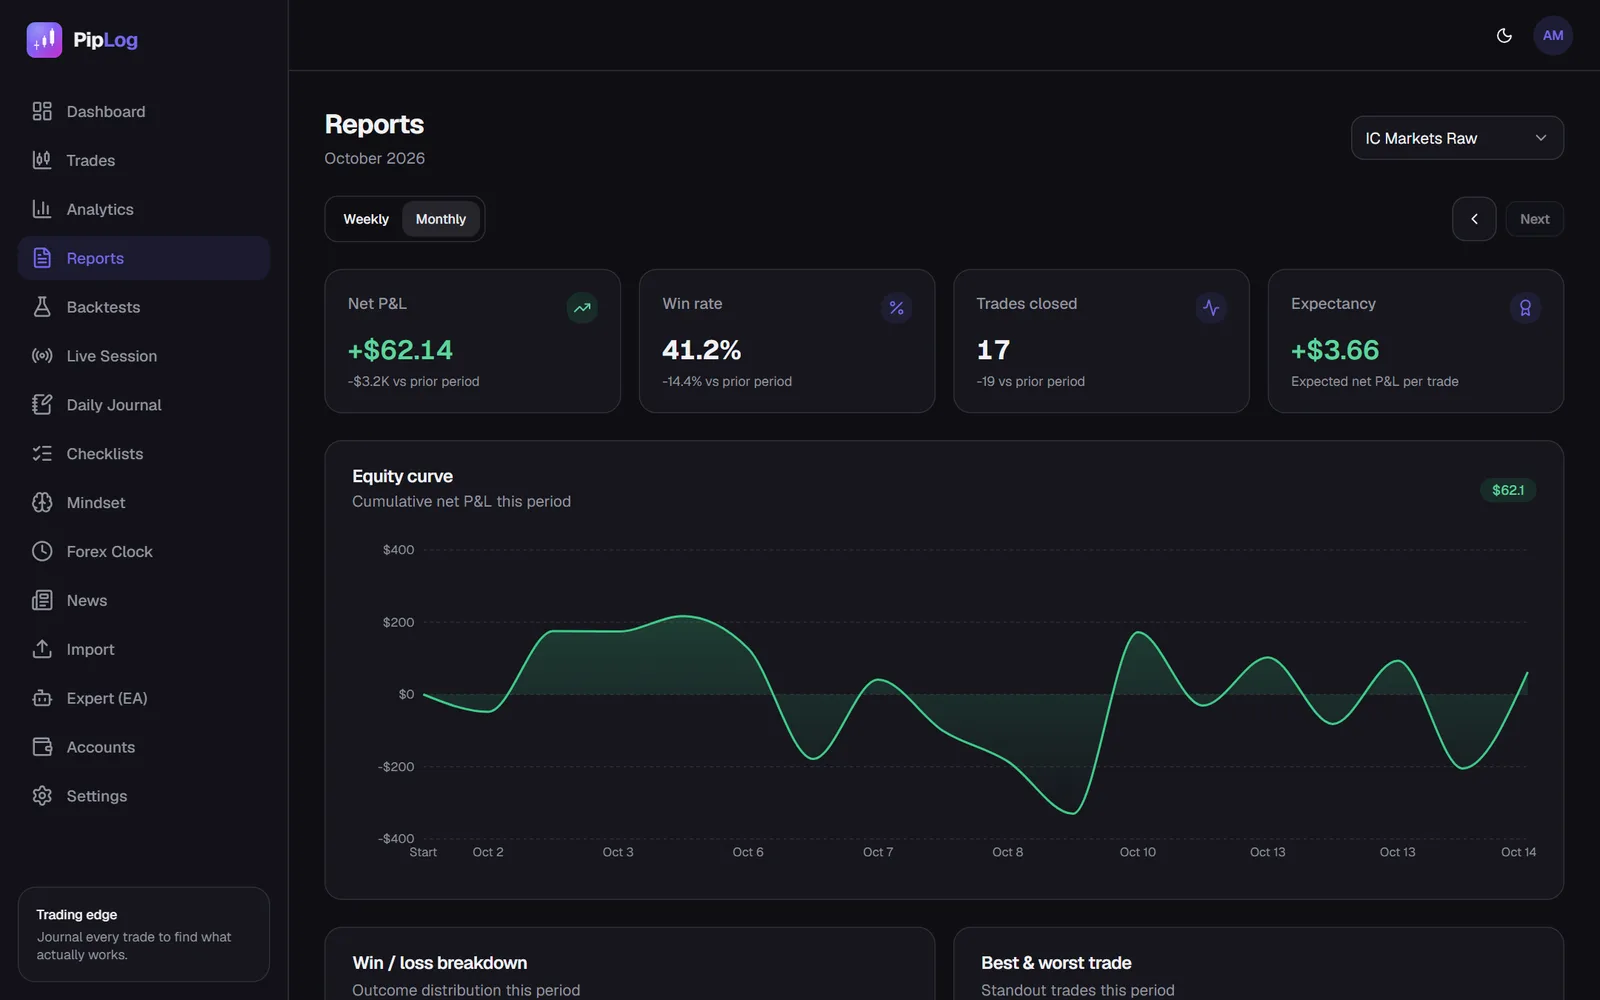
Your MT5 report shows profit factor for the whole period. A journal lets you slice it: by symbol, weekday, direction, month, tag and setup. That's where it becomes actionable.
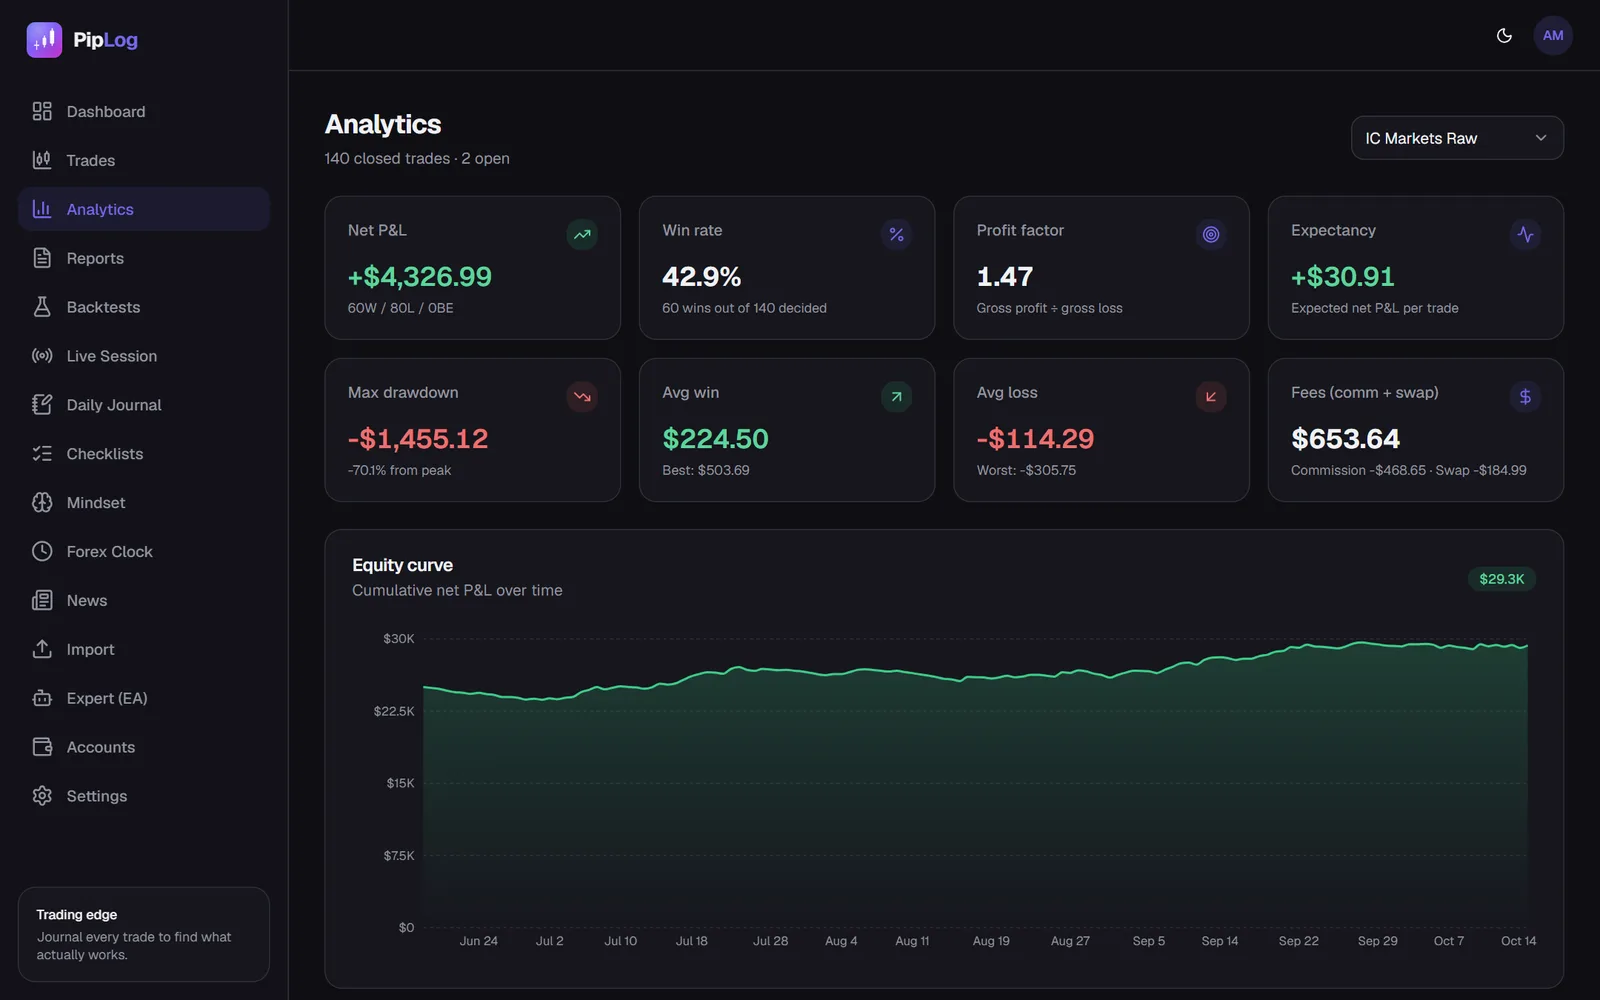
Journal your MT4 & MT5 trades automatically
Import a statement or sync live with the PipLog EA. Win rate, profit factor, expectancy and drawdown are calculated for you.
Start your journalKey takeaways
- Profit factor = gross profit ÷ gross loss, using net trade results.
- 1.3 to 2.0 is a healthy range for most discretionary traders.
- Read it alongside sample size, drawdown and expectancy.
- The fastest improvement usually comes from removing your worst setup or behaviour, not from finding a new one.