12 Trading Performance Metrics Every Forex Trader Should Track
Win rate, profit factor, expectancy, drawdown, average R and more: what each trading metric means, how to calculate it, and what a good value looks like.
"Am I a good trader?" is the wrong question. The useful questions are narrower: Do my winners pay for my losers? How deep do my drawdowns go? Is my edge in one setup, or spread across all of them?
Each of those questions has a metric. Here are the twelve that matter most, grouped by what they tell you.
Profitability metrics
1. Net profit
Total profit after commission and swap. Always look at net, not gross. A scalper paying $7 per lot round turn can be profitable before costs and losing after them.
2. Win rate
The share of closed trades that made money.
On its own, win rate means almost nothing. A 35% win rate is excellent with 3R winners. A 70% win rate is a slow disaster if the average loss is three times the average win. Read win rate vs. risk-reward before you judge yours.
3. Average win and average loss
The average result of your winning trades and your losing trades. Their ratio, sometimes called the payoff ratio, is what win rate needs to be read against.
4. Profit factor
Gross profit divided by gross loss (as a positive number).
Above 1.0 is profitable. Most solid discretionary traders sit between 1.3 and 2.0. We cover it in depth in profit factor explained.
5. Expectancy
The average amount you make per trade. It combines win rate and payoff ratio into one number.
If expectancy is positive across 100+ trades, you have an edge. See trading expectancy.
Risk metrics
6. Maximum drawdown
The largest peak-to-trough fall of your equity, in money and as a percentage. It tells you how much pain your strategy produces, and whether you could survive it emotionally and within prop firm rules. Read maximum drawdown explained.
7. Largest loss
Your single worst trade. If it's much larger than your average loss, you have a stop-loss discipline problem, not a strategy problem.
8. Maximum losing streak
The longest run of consecutive losses. Use it to sanity-check your risk per trade: at 2% risk, a 10-trade losing streak costs roughly 18%.
Risk-adjusted metrics
9. Average R-multiple
Each trade's result divided by its initial risk. A trade that made $300 with $100 at risk is +3R. Average R tells you how well your trades perform relative to the risk you took, which makes results comparable across account sizes and position sizes. See R-multiples explained.
10. Planned vs. realised risk-reward
Planned R:R comes from your initial stop and target. Realised R comes from where you actually exited. A big gap between them, for example planning 2.5R but averaging 0.9R on winners, usually means you're cutting winners early.
Behavioural metrics
11. Results by symbol, weekday and session
Break your results down by instrument, day of the week, direction and month. Many traders discover that one symbol or one day accounts for most of their losses.
12. Rule adherence and tilt
How many trades broke your rules, and what did they cost? Behavioural flags such as revenge trades (opened shortly after a loss), oversized positions and overtrading days are often the cheapest edge you'll ever find, because fixing them doesn't require a better strategy. See revenge trading.
Summary table
| Metric | Formula / meaning | Healthy range* |
|---|---|---|
| Win rate | Wins ÷ closed trades | Depends on R:R |
| Profit factor | Gross profit ÷ gross loss | 1.3 – 2.0+ |
| Expectancy | Avg money per trade | Positive |
| Average R | Avg result ÷ risk | > 0.2R |
| Max drawdown % | Worst peak-to-trough fall | < 20% |
| Max losing streak | Consecutive losses | Know it, size for it |
*Ranges are rules of thumb for discretionary traders, not guarantees. Sample size matters: fewer than 50 trades tells you very little.
How to track these without a spreadsheet
All twelve metrics need the same raw data: open and close times, prices, volume, profit, commission, swap and the initial stop loss. Once your trades are in a journal, the metrics are calculated for you.
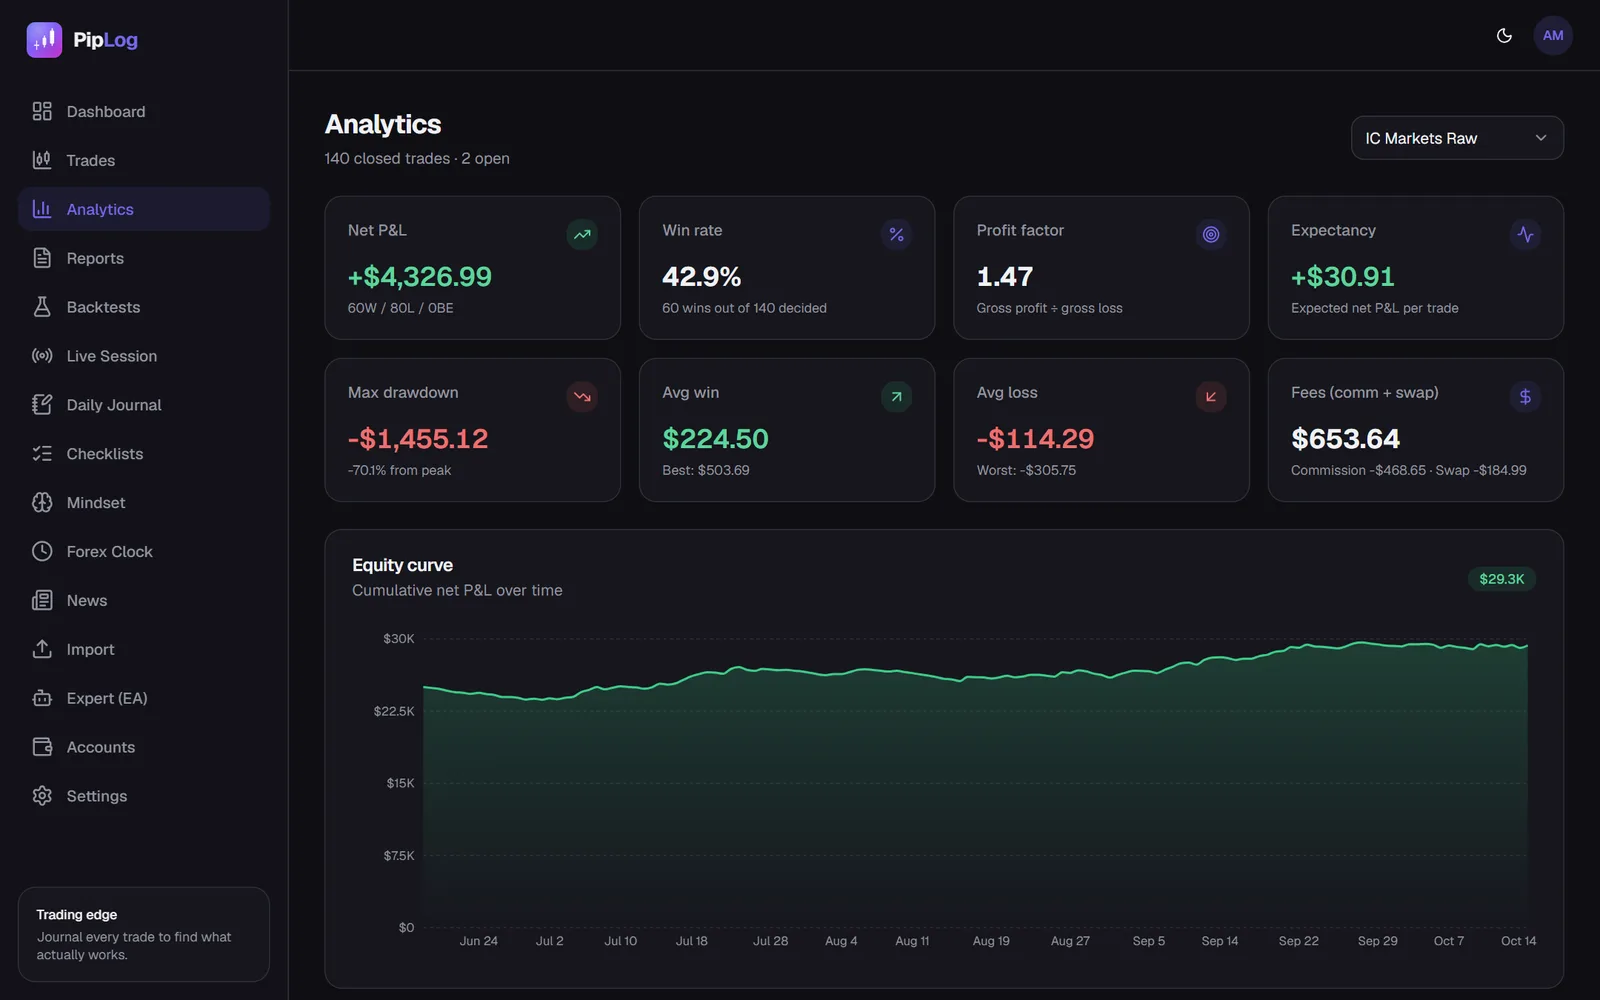
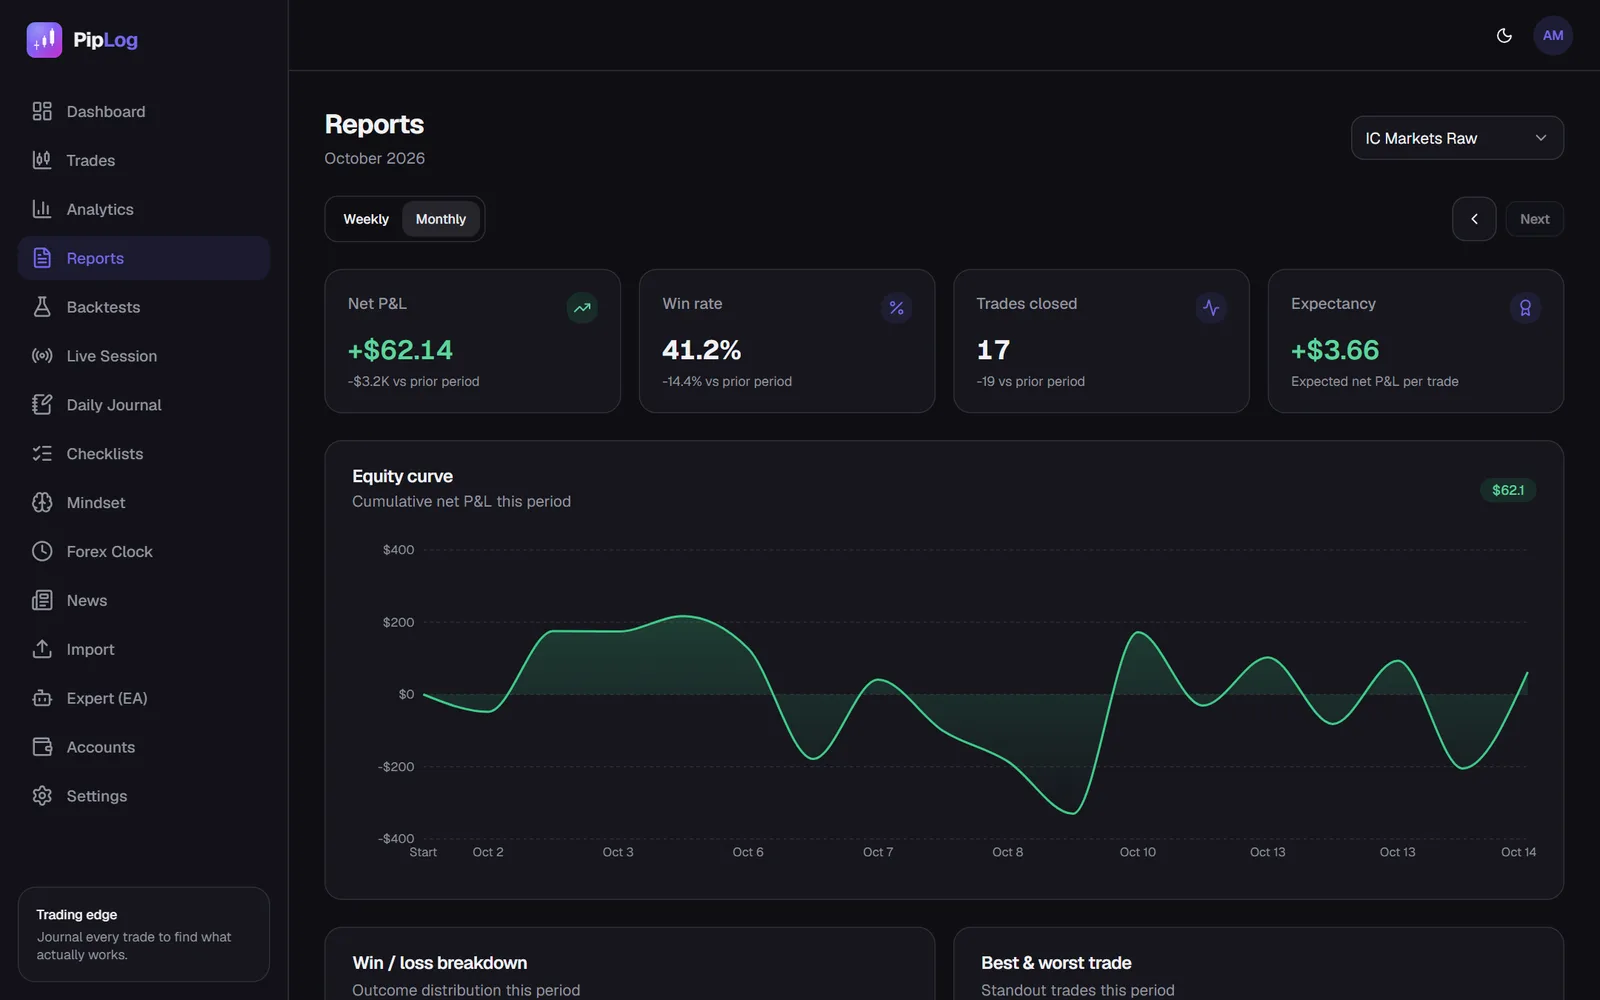
In PipLog, the dashboard shows net P&L, win rate, profit factor, expectancy and drawdown, while Analytics and Reports break them down by symbol, weekday, direction, month and tag, along with planned vs. realised R.
Journal your MT4 & MT5 trades automatically
Import a statement or sync live with the PipLog EA. Win rate, profit factor, expectancy and drawdown are calculated for you.
Start your journal