R-Multiples Explained: Measure Every Trade in Units of Risk
An R-multiple is a trade's result divided by its initial risk. Learn how to calculate R, why it beats dollar P&L for reviewing trades, and how to use it.
"I made $400 on that trade" says very little. Was $100 at risk, or $2,000? R-multiples fix this by measuring every trade against the risk you took on it. It's the single most useful habit you can add to your journal.
What is R?
1R is the amount you would lose if your initial stop loss were hit. Every trade's result is then expressed as a multiple of that risk.
Examples, each with $200 at risk:
| Result | R-multiple |
|---|---|
| +$600 | +3.0R |
| +$200 | +1.0R |
| $0 (break-even) | 0R |
| −$200 (stopped out) | −1.0R |
| −$300 (slippage or moved stop) | −1.5R |
Calculating R from prices
You don't need the dollar risk if you have prices. For a buy:
For a sell, flip the signs. Example: buy EURUSD at 1.08400, stop at 1.08200 (20 pips of risk), exit at 1.08750 (35 pips of profit): 35 ÷ 20 = +1.75R.
Why R beats dollars
It removes position size from the picture
If you traded 0.5 lots last month and 1.0 lots this month, dollar results aren't comparable. R results are.
It reveals stop-loss discipline
Your losses should cluster around −1R. A distribution with losses at −1.6R, −2.2R and −3R tells you that you're moving stops or not using them.
It shows whether you let winners run
Compare planned R:R (from your initial stop and take profit) with realised R on winners. Planning 2.5R and realising 1.2R means early exits are costing you more than any entry problem.
It makes expectancy universal
Expectancy in R works for any account size: +0.3R per trade at 1% risk is roughly +0.3% per trade. See trading expectancy.
Your R distribution
Plot all your closed trades by R bucket: below −1R, −1R to 0, 0 to 1R, 1 to 2R, 2 to 3R, above 3R. A healthy discretionary distribution has:
- A tall bar at about −1R (normal losers)
- Very little below −1R (stops respected)
- A spread of winners, with some trades reaching 2R and beyond
Common R-multiple mistakes
- Using the final stop instead of the initial stop. Every trade where you trailed the stop looks like it had tiny risk and an enormous R.
- Ignoring costs. Commission and swap reduce R. Use net results.
- Trades with no stop. No stop means no defined R. If you trade without stops, record a "mental stop" as the initial stop, honestly.
- Comparing R across different stop logic. A 5-pip scalp stop and a 60-pip swing stop produce very different R distributions. Compare within a setup.
R-multiples in practice
- Always record the initial stop loss with the trade. MT5 statements show only the final stop; the PipLog EA records the stop at entry automatically, and you can set it by hand on imported trades.
- Review average realised R weekly, per setup.
- Check the share of losers worse than −1.2R. If it's above 10%, fix stop discipline before anything else.
- Size positions so 1R is a fixed percentage of your account; see position sizing.
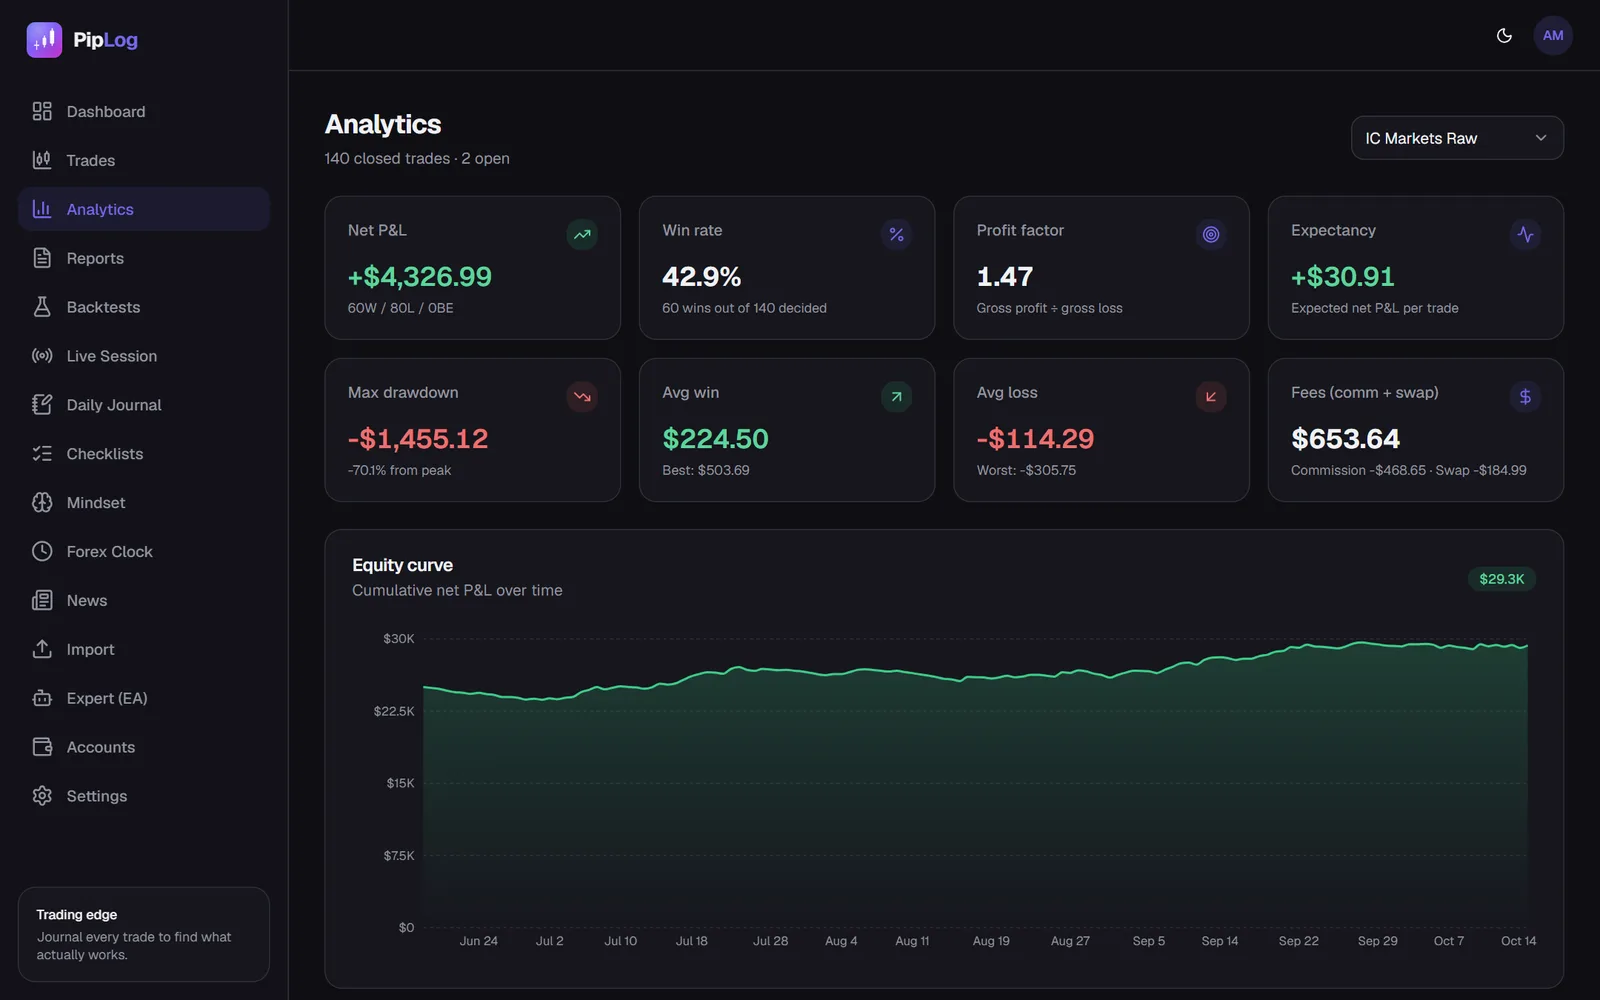
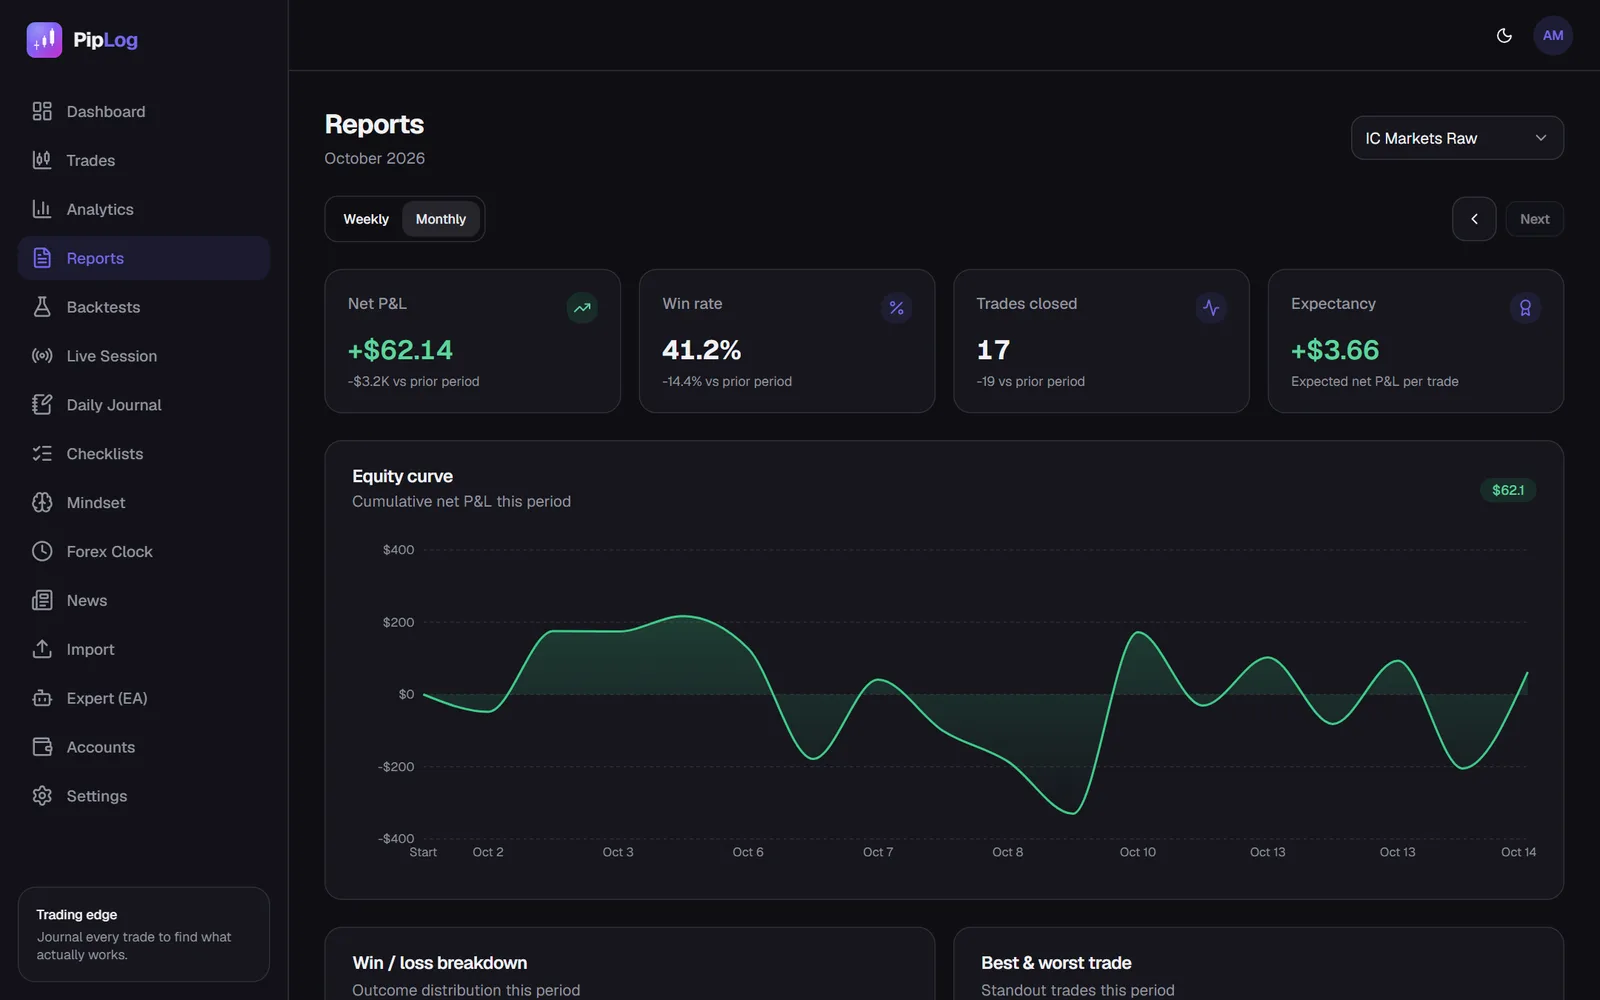
PipLog calculates planned R:R and realised R for every trade with an initial stop, and shows averages, the R distribution, take-profit hits and how often you moved to break-even or trailed.
Journal your MT4 & MT5 trades automatically
Import a statement or sync live with the PipLog EA. Win rate, profit factor, expectancy and drawdown are calculated for you.
Start your journal