How to Backtest a Trading Strategy Manually (and Log Results in R)
A step-by-step method for manual backtesting: write testable rules, replay charts, log each trade in R, and read the results before risking real money.
Automated backtests need code. Most discretionary strategies can't be coded easily, which is why manual backtesting, replaying charts and recording trades by hand, is still the most common way traders validate an idea before risking money.
Done well, it gives you a realistic win rate, expectancy and drawdown for your strategy. Done badly, it gives you false confidence. Here's how to do it well.
Step 1: Write rules you can test
If two people can't apply your rules to the same chart and get the same trades, they aren't rules yet. Write down:
- Market and timeframe: e.g. GBPUSD, M15
- Session: e.g. 07:00 to 11:00 UTC
- Entry condition: precise and visible on the chart
- Stop loss: where, exactly
- Take profit and management: fixed R target, break-even rule, trailing
- Filters: news, trend, volatility, maximum trades per day
Example: "Break of the Asian range high or low after 07:00 UTC. Enter on the first retest. Stop beyond the range midpoint. Target 2R. No trade within 30 minutes of high-impact news."
Step 2: Choose the test period
- Cover different market conditions: trending, ranging, high and low volatility.
- Aim for at least 50 trades, ideally 100 or more.
- Don't pick a period you remember well; hindsight leaks into decisions.
Step 3: Replay the chart honestly
Use your platform's bar replay or the MT5 Strategy Tester in visual mode, and move forward one candle at a time. Rules for honesty:
- Never scroll ahead.
- Decide entry, stop and target before moving forward.
- Record every valid setup, including the ones you "wouldn't have taken".
- Don't change the rules mid-test. Finish the test, then make a version 2.
Step 4: Log each trade in R
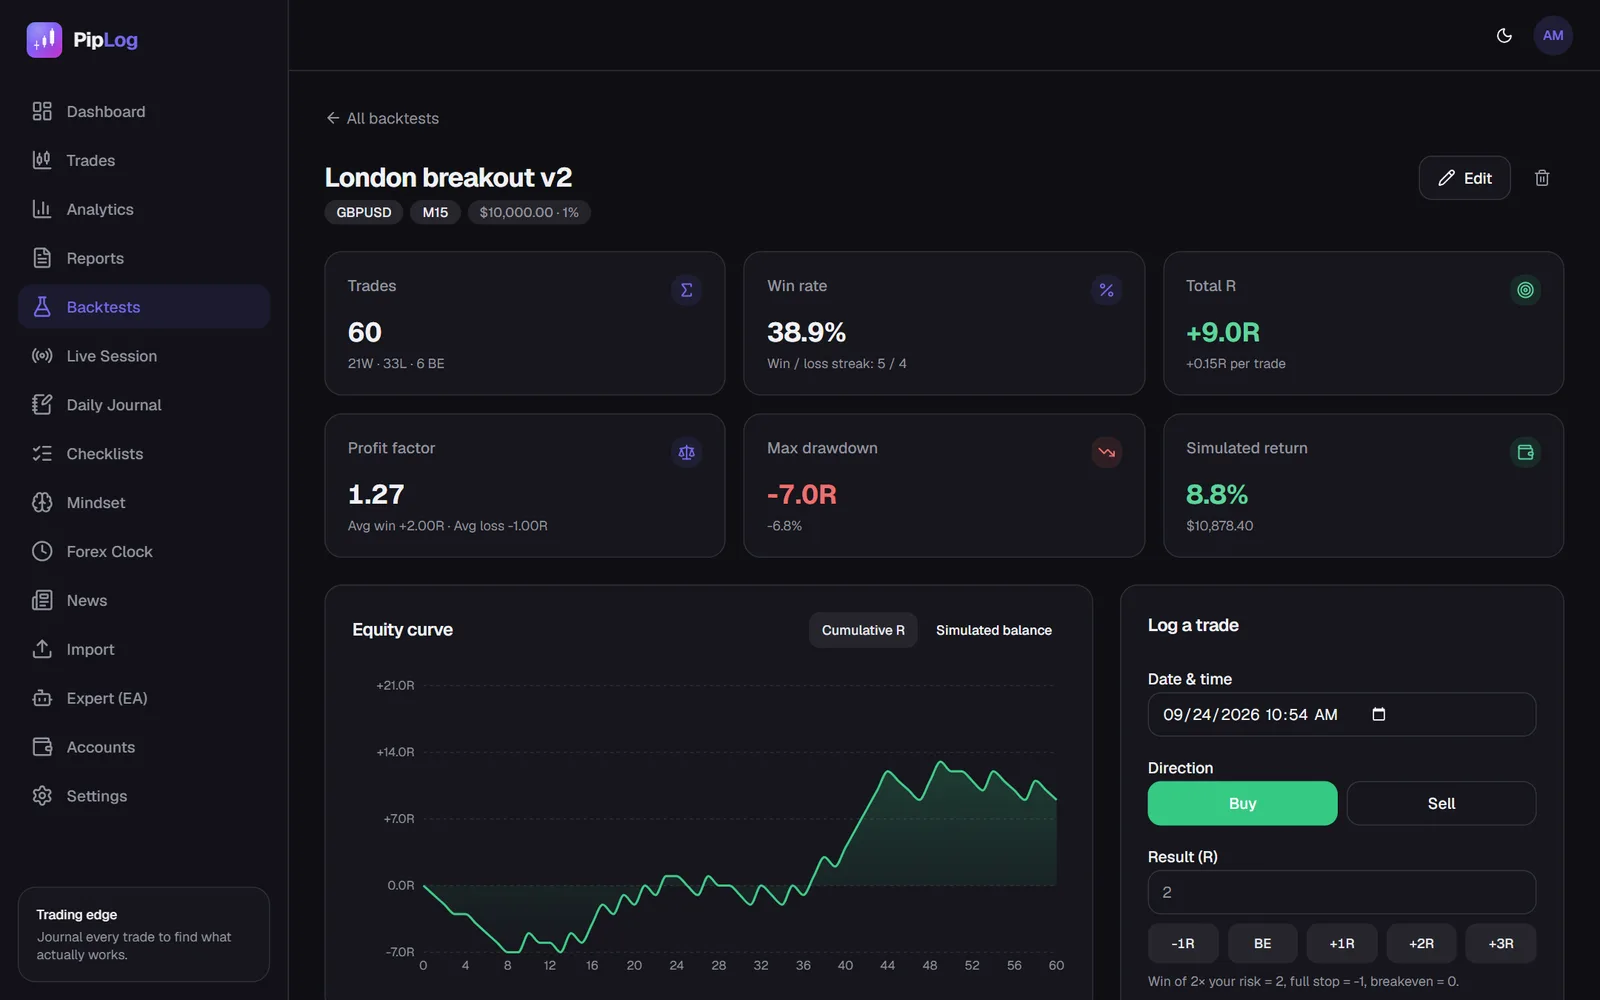
Record results in R-multiples, not in money. A full stop is −1R, a 2R target hit is +2R, a break-even exit is 0R. This makes the backtest independent of account size, and lets you simulate any risk percentage afterwards. See R-multiples explained.
For each trade, log:
| Field | Example |
|---|---|
| Date and time | 2026-03-12 08:15 |
| Direction | Sell |
| Result | +2R |
| Notes | Clean retest, news 2 h later |
Step 5: Read the results
Once you have your sample, look at:
- Win rate and expectancy in R. Is expectancy clearly positive? See trading expectancy.
- Profit factor. Above 1.3 leaves some margin for real-world costs and mistakes.
- Maximum drawdown in R. How many R did the worst losing period cost? At 1% risk, a 12R drawdown is about 11%.
- Longest losing streak. Could you keep following the rules through it?
- Simulated return. Apply your intended risk per trade to the R results to see a balance curve.
PipLog's backtests calculate all of these from your logged R results, and can show which of your simulated trades happened near high-impact news, so you can test a news filter without re-running the backtest.
Step 6: Forward test before going live
A backtest is a hypothesis. Before real risk:
- Forward test on a demo account for 20 to 30 trades.
- Compare demo results with the backtest. Similar expectancy? Similar win rate?
- Go live at reduced risk, and journal every trade.
Big differences between backtest and forward results usually mean the rules weren't as objective as they seemed, or hindsight crept in.
Common manual backtesting mistakes
- Too few trades. 20 trades says almost nothing.
- Skipping "ugly" setups. If it met the rules, it counts.
- Ignoring costs. Subtract spread and commission, especially on tight stops.
- Optimising on the same data. Tweaking rules until the backtest looks perfect is curve fitting. Keep some data aside to test version 2.
- Not tracking the conditions. Note the market regime; strategies often work only in some.
Journal your MT4 & MT5 trades automatically
Import a statement or sync live with the PipLog EA. Win rate, profit factor, expectancy and drawdown are calculated for you.
Start your journalKey takeaways
- Write objective rules first; if you can't test it, it isn't a rule.
- Replay candle by candle and record every valid setup.
- Log in R, then simulate your real risk afterwards.
- Judge on expectancy, drawdown and losing streaks, then forward test before going live.